The S&P 500 officially fell 20% from it’s highs this morning.
But last Thursday morning, it was down only 7% from its highs.
Then Trump unleashed his tariff “plan”. Stocks were down over 10% in two days last Thursday and Friday, and another 4% at the open this morning.
This was a mini-crash.
A quick, but relatively normal pullback turned into a bloodbath on fears that tariffs will cause a recession and further market volatility.
This report is brief and to the point, and we will go over more in our webinar tomorrow. The registration link is further down in this report.
What happened?
- Stocks had a mini-crash on Thursday and Friday, falling over 10% in just two days, after Trump announced tariffs that were much more widespread than many anticipated.
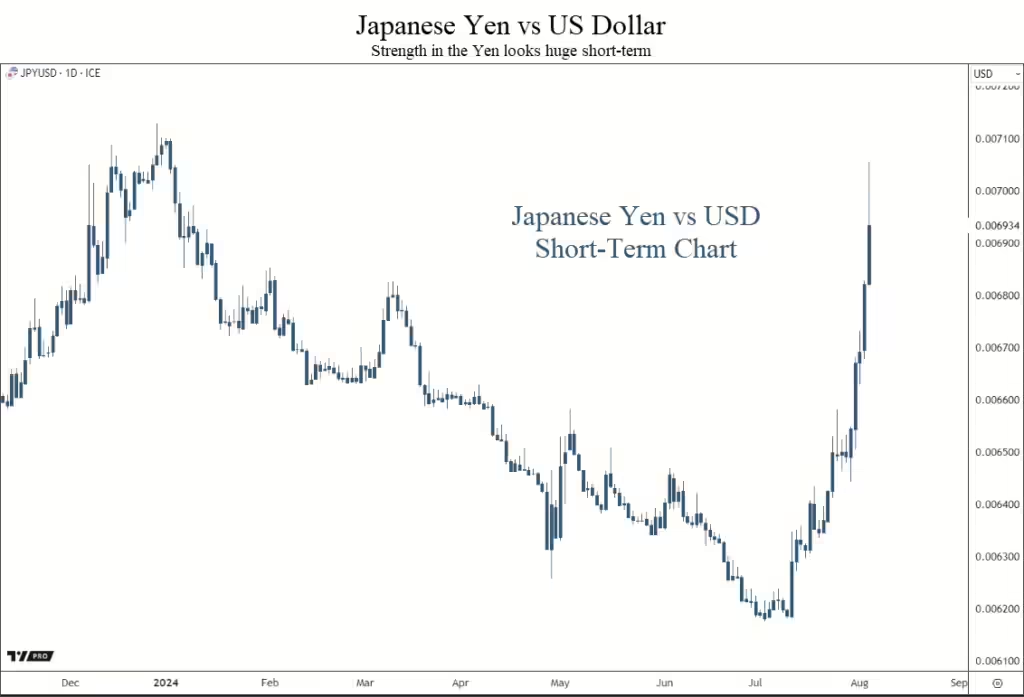
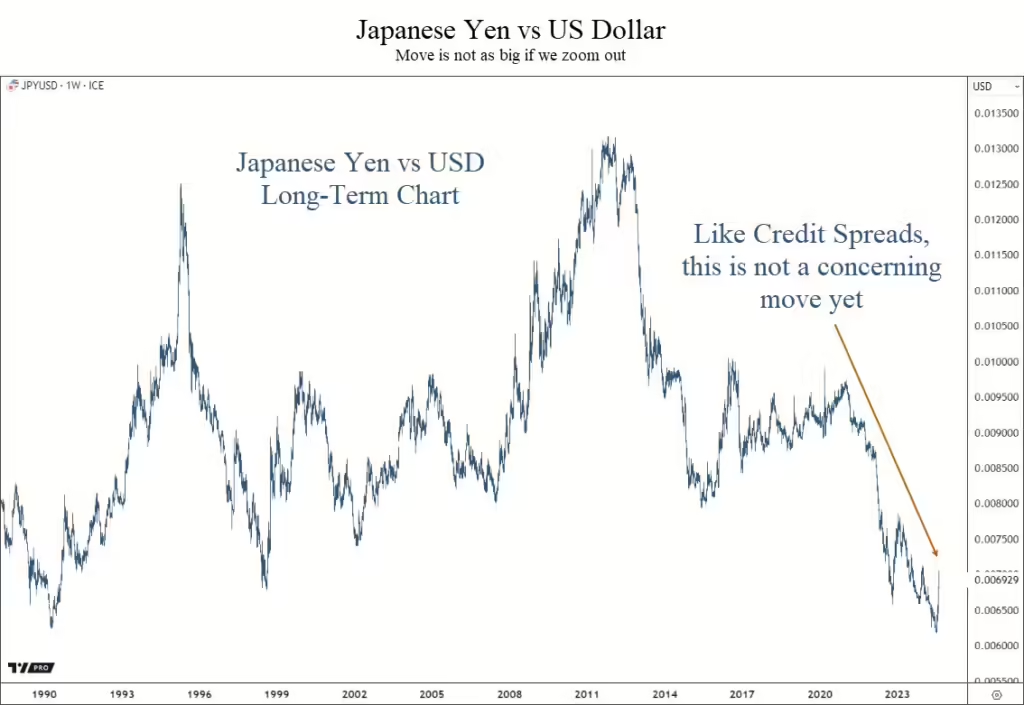
- Concern over tariffs caused a technical selloff similar to last summer’s Japanese Yen selloff.
- Market behavior the past few days has been similar to the COVID-lows.
- This selloff has been about the unknowns with tariffs, as opposed to a deeply engrained structural problem like mortgages in 2008.
- At this point we don’t anticipate this turning into a deeper bear market, but we can’t rule that out yet either.
- We do think we are at or near a short-term low in stocks.
What to Do?
- Don’t panic.
- Keep the selloff in context…markets were only down 7% from all-time highs last Thursday morning.
- Wait until a stronger rally develops to assess whether or not to reduce risk, not while fear and panic are extremely elevated.
- This is not a dip to sell into, despite the elevated fear.
- Stay calm, and reassess market dynamics on a rally.
Why do we think this could be a low?
There are a number of signs pointing to this being a near-term low in markets either today or tomorrow.
- Sentiment at extremes
- VIX spike higher
- Treasury yields reversing higher
- Option flow data is bullish
- Capitulation signals
- Broad, indiscriminate selling
- Bullish divergences
- Panicky conversations with clients
These data points are all quite bullish.
And while they don’t guarantee that the overall pullback is over, it does increase the likelihood that we have seen an interim low in prices.
We will look at charts of these in more detail in tomorrow’s webinar.
Tariffs Discussion
We will also discuss tariffs in more detail tomorrow, but here are our initial thoughts on tariffs:
- Tariffs by themselves are not good, but if their implementation results in the elimination of all or a majority of income taxes in the US, it will be hugely beneficial.
- The stated goal of the Trump administration is to use tariffs to eliminate income taxes of various kinds. A proposal today aims at eliminating capital gains taxes by the end of this year.
- A broader stated goal by the administration is to eliminate the IRS entirely by reducing spending via DOGE and replacing income tax revenue with revenue from tariffs and a national sales tax.
- Tariffs are inherently inflationary.
- Tariffs are more steps towards economic de-globalization, which started with the semiconductor bill passed by the Biden administration. De-globalization is also inflationary without efficiency and productivity gains.
- Potential productivity gains by the implementation of AI could be deflationary.
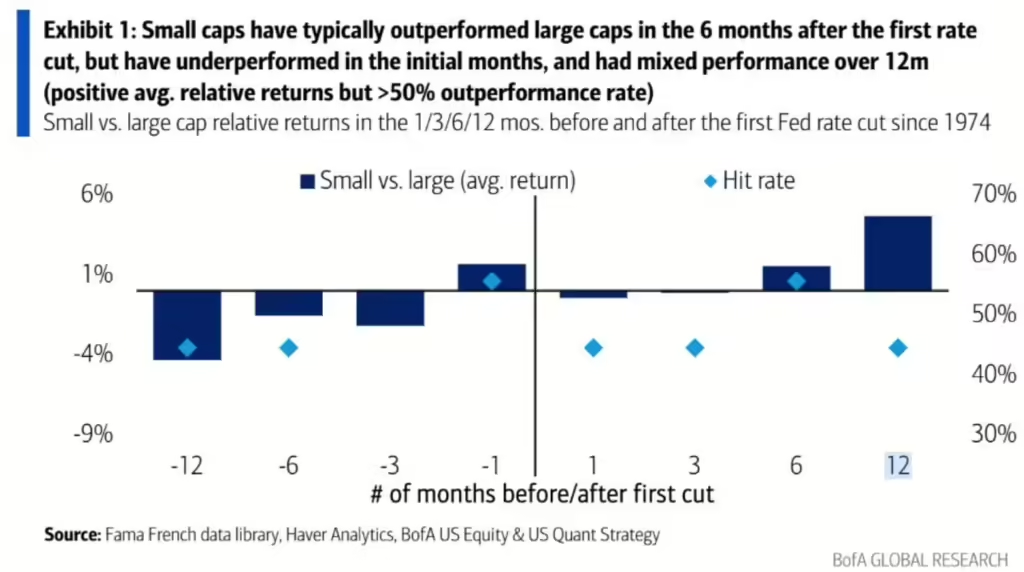
- Small caps and mid caps may have an advantage over large caps going forward due to less overseas revenue and a lower impact from tariffs.
If you are looking to reduce risk, our advice is to wait until volatility has calmed down, which we expect over the coming weeks, if not sooner.
Don’t forget to register for our webinar tomorrow at 4pm central time. Click to register.

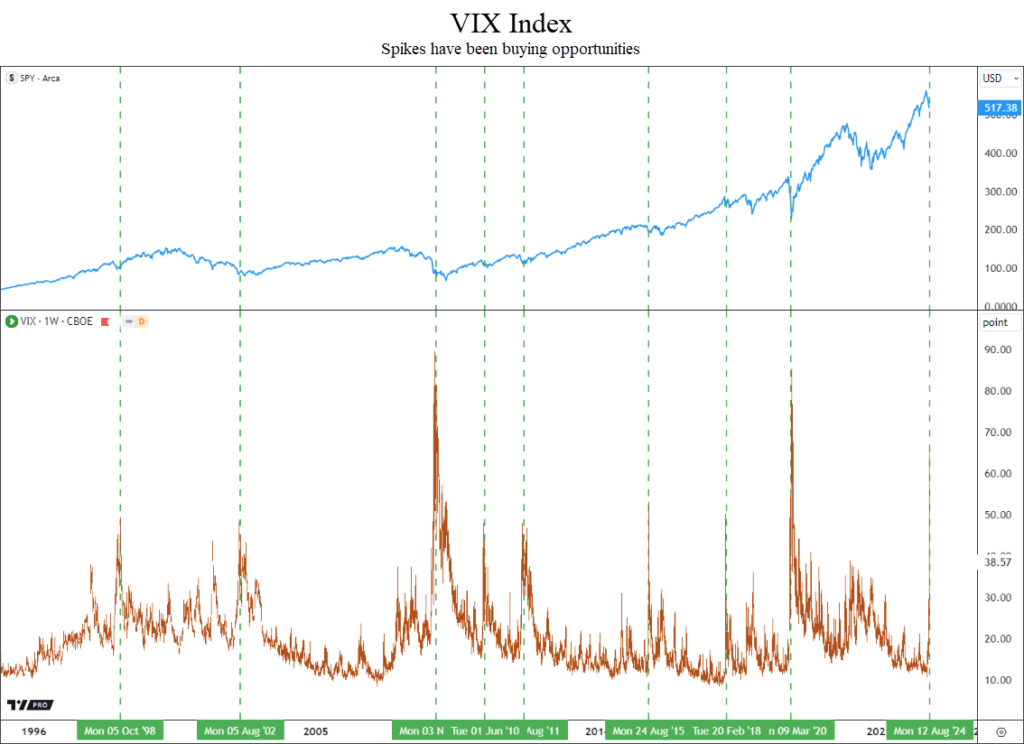
Volatility Spikes Occur Around Lows
Dramatic spikes higher in volatility tend to be a characteristic of a low point in markets.
This latest pullback appears to be no different, despite the harshness of the move.
In fact, we should probably get used to environments where volatility spikes very quickly like we have seen the past few days.
We know, that doesn’t make it feel any better.
But this type of move tends to occur at or near the end of major selloffs, as shown in the chart below.
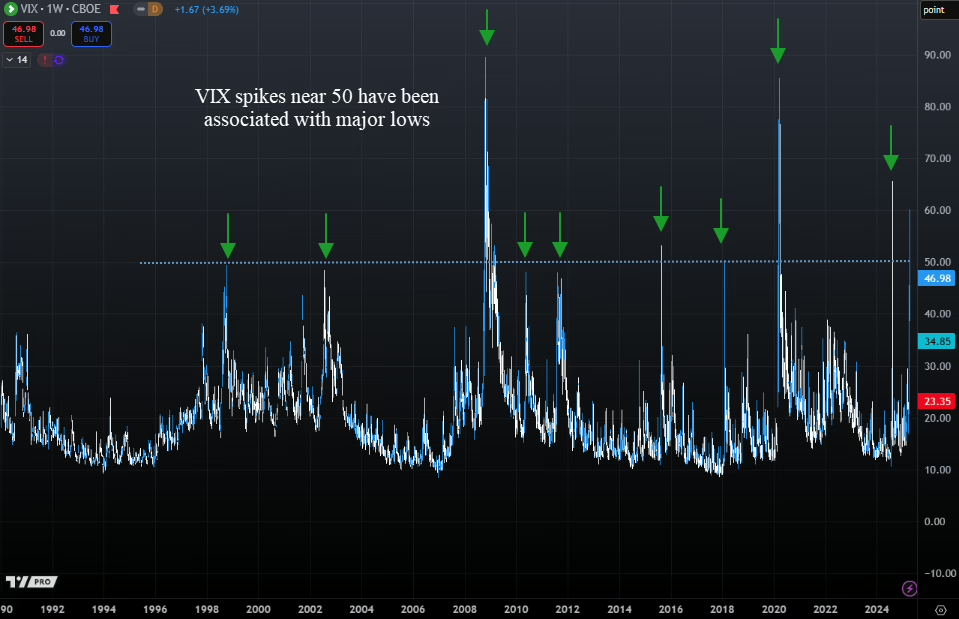
The bear market of 2008 had multiple spikes in the VIX that only resulted in short-term rallies of a few weeks.
But during other selloffs, the VIX moving near or above 50 marked the end of the selling. Today, the VIX touched 60, the highest level since the Japanese Yen selling last summer.
We have now seen two days (Thursday and Friday) that were both down at least 4%.
With stocks down again today, this marks only the 4th time in history we’ve seen selling like this.
What happened next was bullish over the near term, as shown in our next chart below.
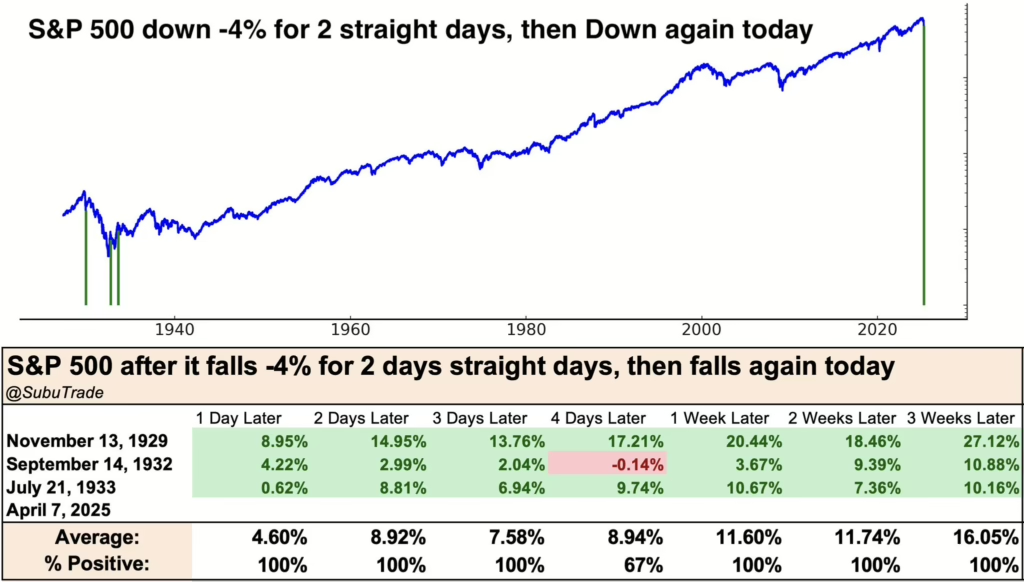
Returns following this type of volatility has been strong historically.
Average returns were over 11% when looking one week out.
This is a small sample size with only 3 occurrences, so we can’t take too much concrete information from it. But it shows that markets tend to bounce back strongly, at least over the near term.
Largest Two-Day Declines
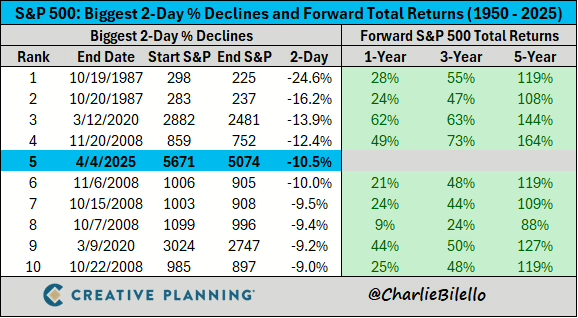
The two-day decline last Thursday and Friday was the 5th largest two-day decline in history.
What has happened after previous large declines?
The first chart below from Charlie Bilello (twiiter @charliebilello) shows the ten largest two-day declines in S&P 500 history.
There is no question about it, these have been buying opportunities, not selling opportunities. Returns have been much higher than average following selloffs like this.
If we look more closely at the chart above, all of the declines took place in 1987, 2008 or 2020. Not great company.
But this type of volatility not only tends to have strong returns looking over a 1-year timeframe or more, it also has marked the low point of major bear markets, as shown in the next chart below.
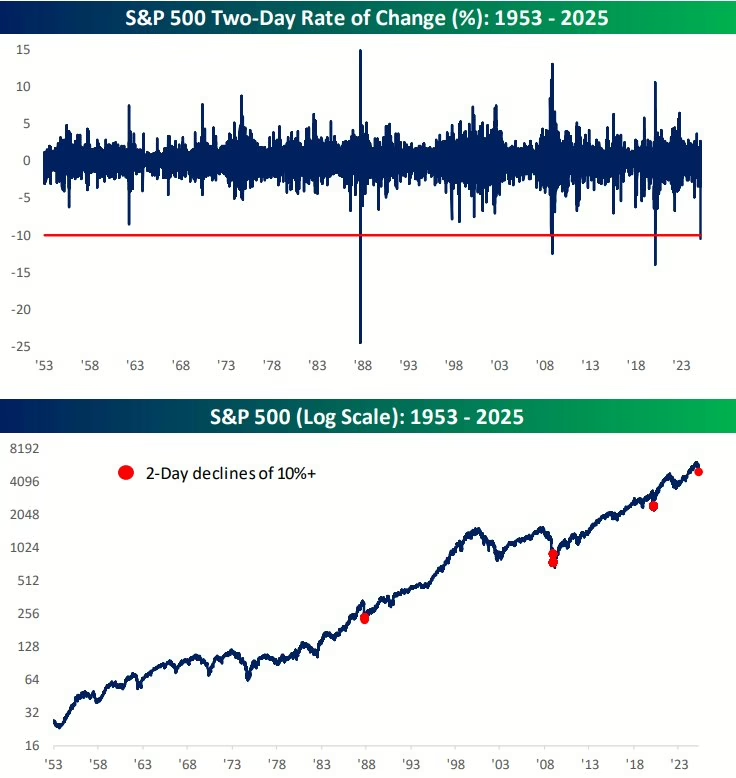
The top half of this chart shows a two-day performance of the S&P 500, while the red dots on the bottom half of the chart show when two day returns fell more than 10%.
Each of these occurred near the ultimate low of major bear markets.
But what about on a shorter time horizon?
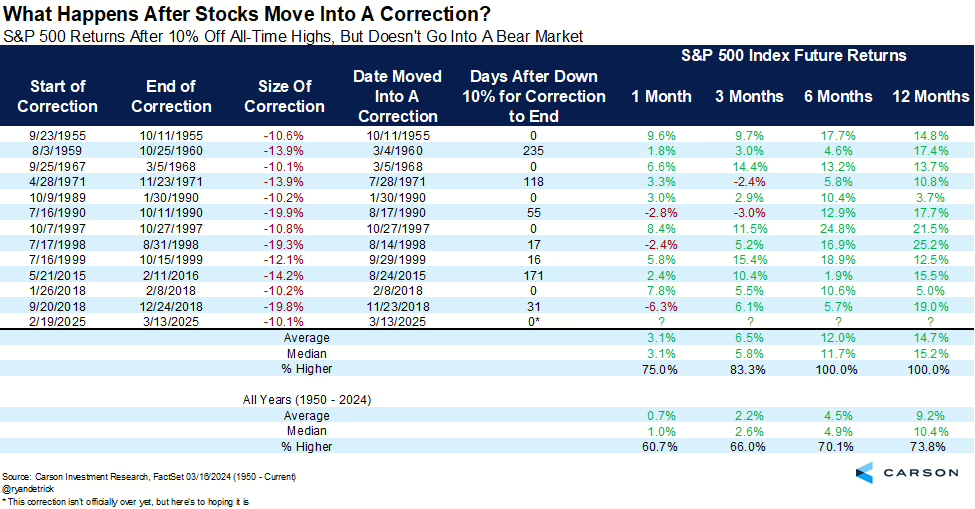
Let’s look at what happened when we had very fast corrections.
Fastest 10% Corrections
Before the tariff selloff last week, markets were already moving quickly lower.
In fact, the S&P 500 had the 6th fastest 10% correction from all-time highs in history recently.
What happened next?
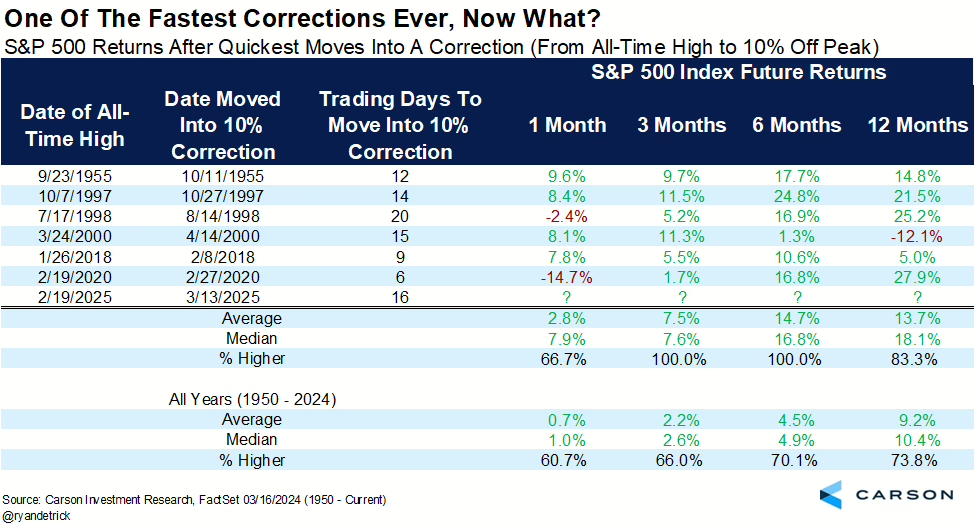
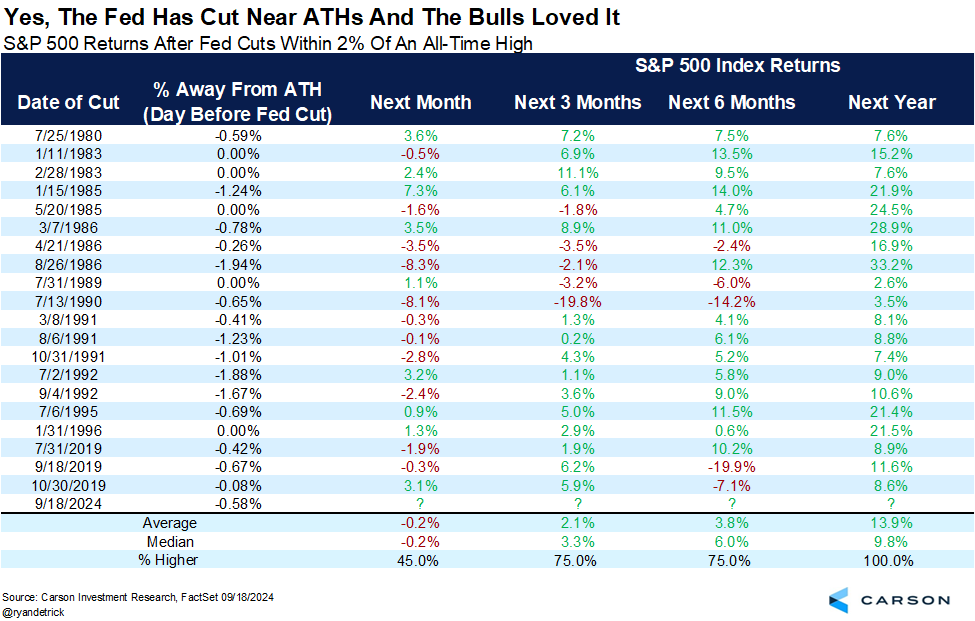
This chart shows that on average the market is nearly 15% higher on average after only 6 months.
This tells us that the speed of this overall correction also suggests that forward returns should be strong over the shorter-term as well, not just over the longer-term.
Bottom Line
The data suggests that we should expect an interim low any day, followed by a strong rally.
This doesn’t mean the decline is over, but economic and earnings data would have to deteriorate badly for further declines in stocks to occur. We are not ruling that out, it is just not the likely scenario at this point.
Earnings reports are starting this week, so we will have plenty of commentary from CEOs on the impact of tariffs on their business.
We will discuss more in our webinar tomorrow.
Invest wisely!

