• Skip to main content
  • Skip to footer

IronBridge Private Wealth

Forward with Confidence

  • Home
  • Difference
  • Process
  • Services
  • Insights
    • IronBridge Insights
    • Strategic Wealth Blog
    • Strategic Growth Video Podcast
    • YouTube Channel
  • Team
  • Clients
  • Form CRS
  • Contact Us

Ukraine War: Portfolio Update

March 4, 2022

We shared two other reports this week regarding the Ukraine War:

  • Informational Resources: View Report
  • Market Update: View Report

Today, we’ll give a brief update on our clients’ portfolio positioning given the uncertainties in Ukraine.

This report will be brief. Please reach out to us directly if you would like to discuss your individual portfolio in more detail.

We will provide another market update next week.

For now, let’s focus on three primary asset classes:

  1. Cash
  2. US Equity
  3. International Equity

We will look at two basic portfolios today: Balanced and Aggressive Growth.

We do have clients with custom portfolios, so please reach out if you would like a detailed snapshot of your account.


Balanced Portfolios

Let’s look at balanced portfolios this year.

Specifically, let’s look at the change in allocation from the start of the year.

The chart below shows three major asset groups (Cash/Fixed Income, US Equities and International Equities), and how much of a balanced portfolio was invested in each on three different points this year:

  • December 31
  • January 31
  • Current (March 4)


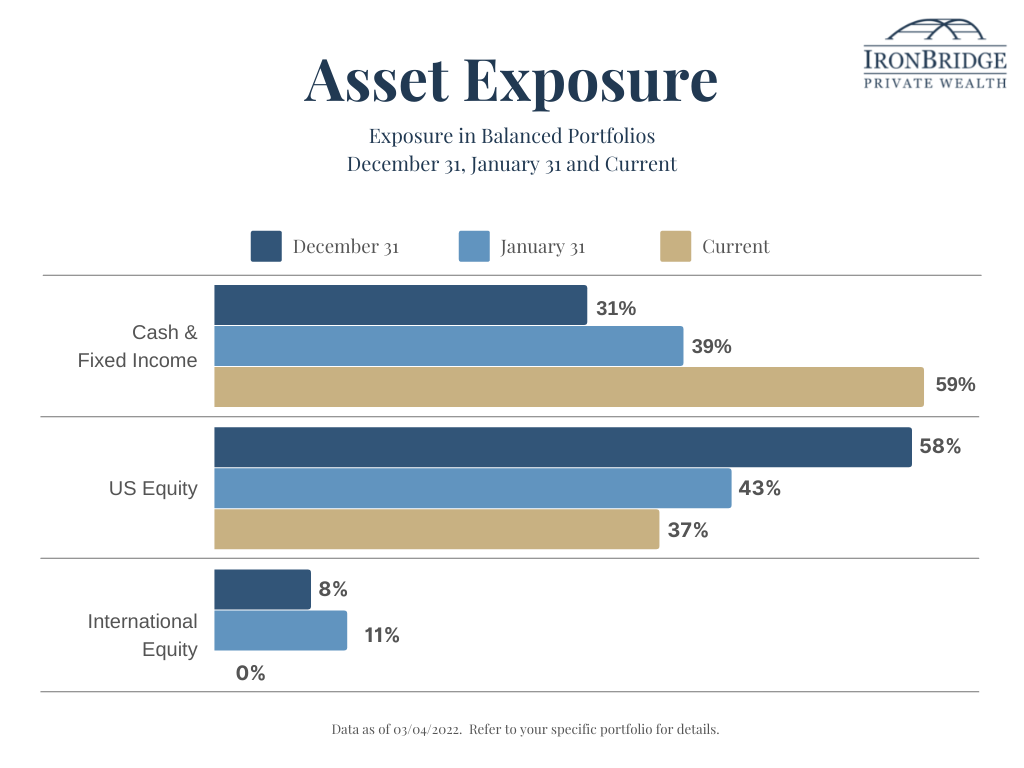
In this chart, the dark blue is the exposure to each asset class on December 31st. The lighter blue shows exposure on January 31st, and the gold is the current allocation to that asset class.

Broadly, this chart shows the following changes from the end of last year to now:

  • Cash/Fixed Income: increased from 31% to 59%
  • US Equity: decreased from 58% to 37%
  • International equity: decreased to 0% once Russia invaded Ukraine.

Since the start of the year, overall stock exposure (US plus International) fell from 66% to 37%.

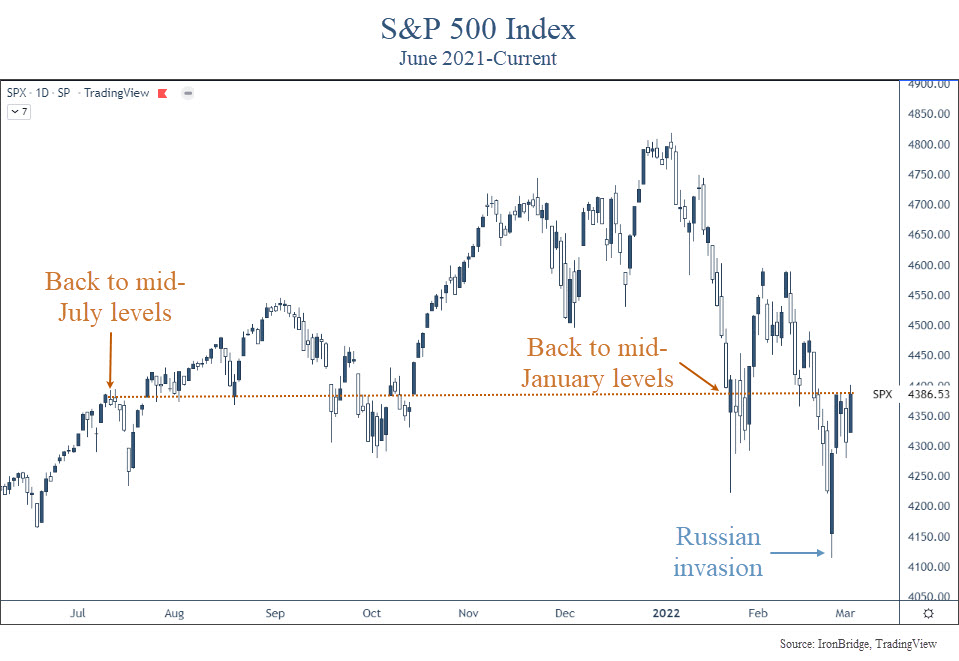
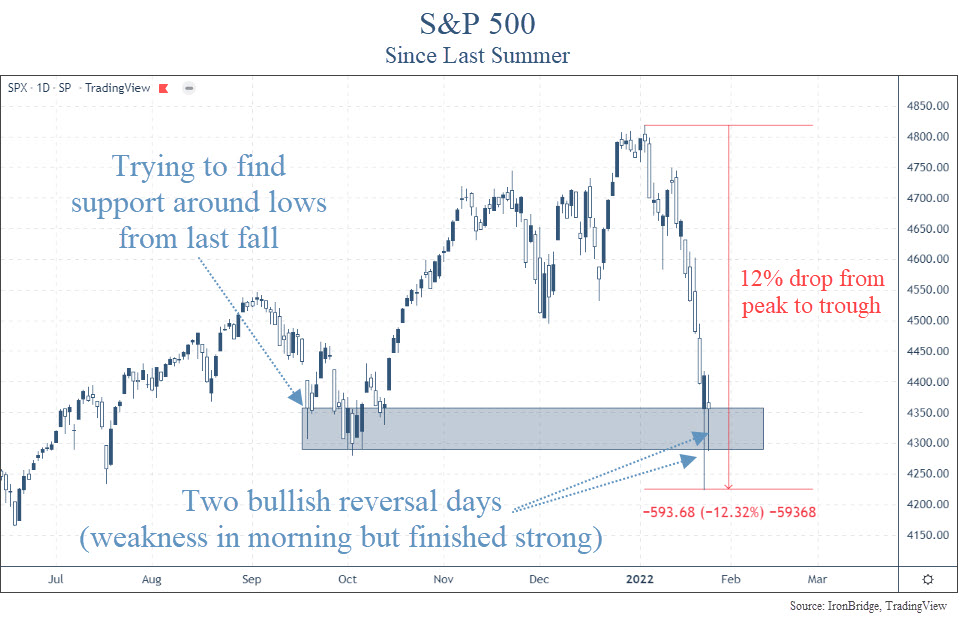
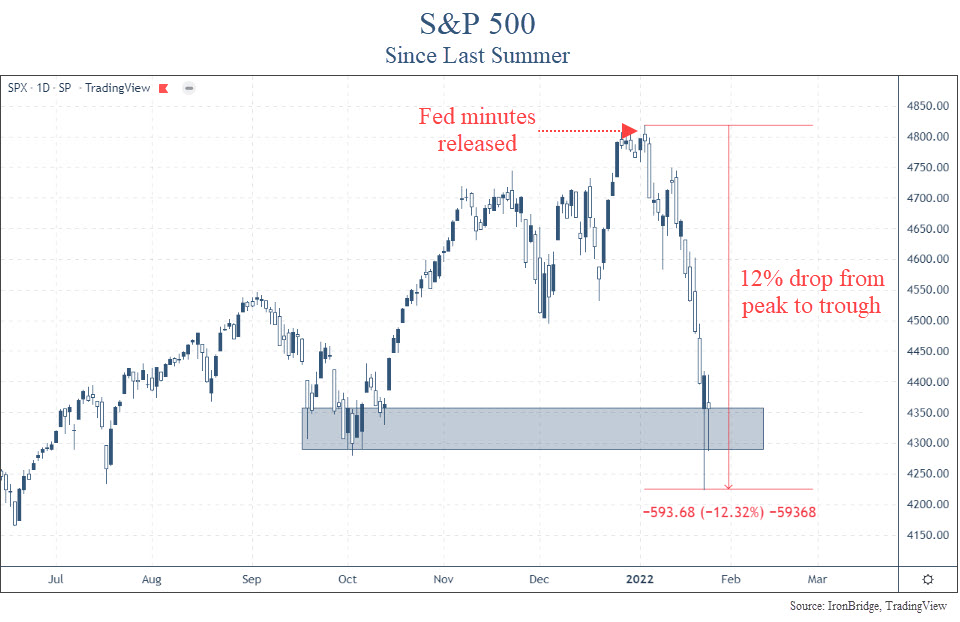
This is very large increase to safer assets this year, especially given that there has only been roughly a 10% decline in the S&P 500 so far this year.

Now, let’s look at the same chart for more aggressive portfolio.

Aggressive Portfolios

Here is the same chart as above, only for portfolios that are more aggressive.


This tells the same story:

  • Cash/Fixed Income: increased from 6% to 40%
  • US Equity: decreased from 82% to 55%
  • International equity: decreased to 0% once Russia invaded Ukraine.

For both portfolios, clients should expect to see lower volatility now than in the first few weeks of the year.

This also speaks directly to one of our core objectives at IronBridge: to eliminate the big downside scenario.

We cannot avoid volatility, nor do we want to. You must have volatility if you want to try to achieve decent returns over time.

But by reducing exposure to risk on a total portfolio basis, you can greatly reduce the risk of having large, damaging returns.

Changes in the Composition of Equity Exposure

If the first tool in your risk management toolbox is your overall exposure to cash, the second tool is the characteristics of the assets that are still invested.

The charts above show that overall stock exposure has decreased this year.

The other thing that has happened is that the stocks in which you were invested changed as well. Specifically, the characteristics of those stocks changed.

Here are various ways the amount invested in stocks has changed this year:

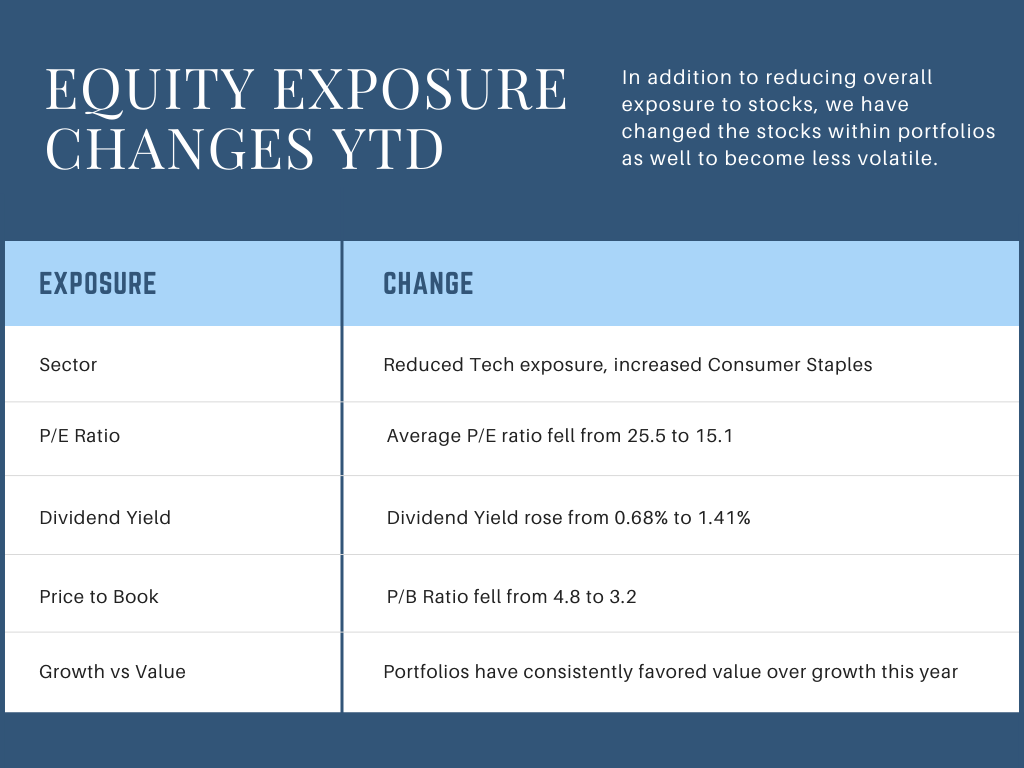
All of the items listed above should contribute to lower volatility in the stocks you are still invested in.

Sector exposure changed from aggressive (technology) to defensive (consumer staples).

Stocks with lower P/E ratios and price-to-book ratios typically have lower volatility.

And we have had a very distinct shift from growth to value in your portfolio as well.

Why we like Cash for Risk Management

As shown above, cash exposure for all clients has increased substantially this year.

We strongly believe that cash is THE BEST way to manage risk.

Why?

Cash is predictable.

There are other ways to manage risk: hedging, asset allocation, derivatives in futures markets, certain options strategies and shorting stocks.

Each of these can be effectively used. But they are complex and have various other risks that come along with them.

To do this effectively, you MUST have a process. You cannot have emotion be a part of the decision.

Why? Because we are humans and we are not very good at combining rational actions with emotional feelings.

Bottom Line

We have continued making portfolios less aggressive and less exposed to risk. As long as the market is showing volatility, we will continue doing that.

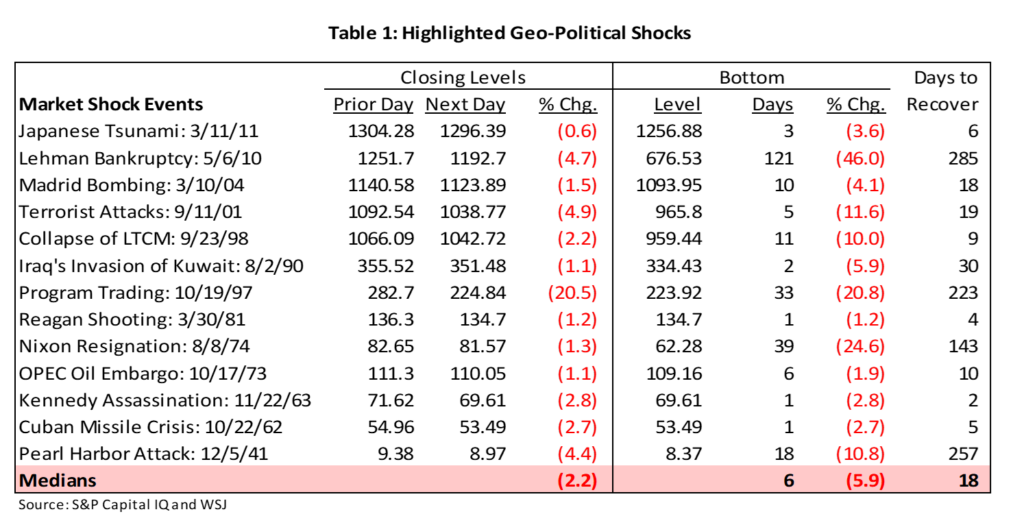
Given the continued approach by Putin to dig in his heels and extend the duration of this war, markets are likely to remain volatile.

We are positioned for volatility now, and may become more defensive as time goes by.

As always, please let us know if you have any questions.

Invest wisely!


Filed Under: IronBridge Insights Tagged With: bonds, cash, investments, portfolio, russia, stocks, Ukraine, war

Ukraine War: Market Update

March 2, 2022

There is a LOT happening in markets this week. As we said in our email on Monday, this may be the most important week since the 2008 financial crisis.

Today we’ll discuss a few of the major issues we’re watching:

  • Sanctions against Russia (the Financial War)
  • S&P 500
  • The Fed

As a note, we’ve put together a series of resources that we have been tracking, which you can reference here:

Ukraine War: Informational Resources

Let’s get started.


Sanctions against Russia (aka, the Financial War)

Once Russia invaded Ukraine last Thursday, the U.S. and the European Union announced a series of initial sanctions against Russia and various Russian companies. These sanctions were quick and were very coordinated among nations.

This immediately caused Putin to fight three separate wars: a military one in Ukraine, a financial war with the global financial system, and a war of perception at home.

Let’s focus on the financial war.

Frankly, once the initial sanctions were announced last week, we perceived them as basically useless.

Nearly every one allowed the entities and individuals sanctioned a 30-day window to comply with the sanctions. This meant that they weren’t going to take effect until potentially AFTER the war was over.

However, over the weekend, the sanctions became much more punitive.

They were also universally approved by the US, European Union, and the UK. Other countries such as Switzerland, Australia, Japan, New Zealand and Taiwan have all made their own sanctions against Russia as well.

There are essentially four types of sanctions being imposed:

  • Financial
  • Trade-Related
  • Sanctions on Individuals
  • Travel

Here’s our overview of these sanctions:

All of these sanctions have two goals:

  1. Punish Russia financially by freezing financial resources and removing them from the global financial system.
  2. Turn global and Russian sentiment against Putin.

So far these are working well in the short time they have been in effect.

Russia has $640 billion in foreign reserves that have now been frozen. The war is costing them approximately $20 billion per day. By most estimates, Russia has $200 billion of unencumbered assets within Russia that have not been frozen by sanctions.

That means that financially, Russia could possibly run out of money in 10 days.

We shall see, but the initial response is that the sanctions have indeed put Putin in a tough situation.

But what impact has the war had on the stock market?


S&P 500 Index

Historically, when wars begin, the stock market tends to bottom near the time of the initial invasion. This has been true for every major war since the Germans invaded Poland at the start of World War II.

So far, markets have responded to the Russian/Ukraine war as markets historically have done…by rallying higher against almost every ounce of common sense any of us possess.

As of today (March 2nd), the low point of the market happened on Thursday, February 24th. This was the day that Russia invaded Ukraine.

Since then, the S&P 500 is UP nearly 7%.

The chart below shows the S&P 500 Index since last June.

The first thing we notice is that the low point of the market thus far was immediately following the invasion. Despite the onset of this war, markets are essentially the same place they were in mid-January.

The second thing we notice is that the market was down “only” 2% the morning of the invasion.

That sounds like a lot, but relative to the volatility that occurred during the COVID crash, when markets moved nearly 10% any given day, a 2% move isn’t overwhelmingly bad. Especially given the fact that many people think this could lead to a nuclear war.

However, during the COVID crash, and also during the bear market of late 2018, markets regularly moved 2% a day.

But this pullback feels worse, doesn’t it?

That could be because we have been lulled to sleep by a very calm market in the past couple of years. It also could be that the risk of nuclear war seems like a reality for the first time in decades, which is obviously nothing to ignore.

Either way, people in general seem to have a more negative feeling towards these developments.

While the invasion itself didn’t cause much volatility, markets definitely anticipated volatility prior to the onset of this unnecessary war.

In fact, the S&P 500 was down 14% from peak-to-trough intraday in 2022, while the Nasdaq and Russell 2000 were both down over 20% peak-to-trough.

Does the fact that we didn’t see much volatility since war began mean we’re in the clear?

The answer is both “maybe” and “absolutely not”.

There are a number of positives that could result in a strong market if the Ukraine war comes to a peaceful and quick resolution:

  • The economy is strong.
  • The consumer is strong.
  • The Fed is now likely to slow down their pace of interest rate increases, resulting in continued support of financial markets.
  • The world is unified against Russia, making a coordinated effort to overcome the fallout from sanctions more economically and politically realistic. (Supplying Europe with gas from the US, for example.)

So if we get a peaceful resolution, there are reasons to be optimistic.

However, the elephant in the room is Putin. More accurately, he is the wild animal who is cornered and scared.

Dictators have one goal: to remain in power.

And Putin’s reputation has been greatly diminished both globally and domestically.

If he can’t get out of this situation peacefully, save face, and retain power all at the same time, there is no telling what he might do. And this is the risk we all fear.

Let’s refocus on the financial markets.

Prior to the Ukraine mess, the markets were selling off because concerns on inflation and the speed at which the Fed might act.

What should we expect from the Federal Reserve now?


The Fed

What might the fed do now?

The easiest way to look at this is what the anticipation of Federal Reserve rate hikes might be.

The next chart, from Bianco Research, shows the probability of Fed rate hikes at each upcoming Fed meeting.

Here’s how to read this table.

On the top left, the FOMC Meeting on 16-Mar-22 shows (from left to right across the table) a 100% probability of a hike of 0.25-0.50%, a 21% probability of a 0.50-0.75% hike, and so on. (FOMC stands for “Federal Open Market Committee”)

This tells us that the market is now pricing a 0.25% hike in March, and a total of four rate hikes this year.

Three weeks ago, there was a probability of over 90% of a 0.50% rate hike in March, with 6-7 hikes likely this year.

So the Ukraine situation is causing the Fed to pause slightly, at least for now.

That could create a tailwind for stocks as well.

But they are definitely behind the curve.

For the past 30 years, the Fed Funds rate has essentially mirrored the 2-year US Treasury yield, as shown in the next chart.

But if we zoom in to the recent rise in the 2-year Treasury yield, we see just how far the Fed needs to go to catch up.

Six months ago, these rates were the same.

Now, the Fed would need to hike 6 times to catch up to the 2-year yield.

This is their dilemma.

The other thing to note on the chart above is that the 2-year Treasury yield barely moved in response to the Ukraine war.

Globally, investors have not been moving into safe havens like we would normally expect.

Bottom line, we are not seeing the type of volatility that we would probably expect in a conflict with the implications of this one.

That leads us to believe one of two things will happen:

  1. Markets are correct. This implies that the Ukraine conflict will come to a conclusion within a week or two.
  2. Markets are unprepared. This implies that the real volatility is yet to come.

We don’t like to think about what happens in scenario 2.

But we must think through it and be prepared for any scenario, for that is our job as fiduciaries of your capital.

On Friday, we will give you a portfolio update and look at the specific levels on the markets that we are watching.

Invest wisely!


Filed Under: IronBridge Insights Tagged With: fed funds rate, federal reserve, fiduciary, investing, markets, russia, treasury yields, Ukraine, volatility, war

Ukraine War: Informational Resources

February 28, 2022

During times of uncertainty, information is critical. We have been tracking multiple resources to follow developments in Ukraine, and wanted to share these with you.

Unfortunately, the major US News outlets are filled with partisan slant. It is distracting, and more resembles propaganda most likely found within Russia than what should be presented by an unbiased and informed media (and we’re referring to both sides of the political aisle).

Instead, we have been following a variety of different informational resources that we have found to be objective and informative.  We hope that you find these helpful if you’re interested in tracking developments in the conflict. They are listed below.


BEST NEWS OUTLET:

  • BBC World News: https://www.bbc.com/news

BEST ARTICLES ON SPECIFIC TOPICS:

  • Markets & War: Investor Amnesia: A History of Invasions, Wars and Markets
  • The SWIFT Sanction: What is SWIFT and Why is it Being Used against Russia, WSJ
  • History of Ukraine: The History, Geography, People and Culture of Ukraine, Encyclopedia Britannica
  • Vladimir Putin: Wikipedia Page

BEST REAL-TIME MAPS & DATA TO TRACK THE CONFLICT:

  • New York Times: Tracking the Invasion of Ukraine
  • Council on Foreign Relations: Global Conflict Tracker

BEST FREE DAILY MARKET UPDATE:

  • Bloomberg’s Five Things: https://www.bloomberg.com/account/newsletters

BEST SOCIAL MEDIA FOLLOWS:

  • Twitter: Major General Mick Ryan (sample below)
  • Twitter: Ukraine President Zelensky (we’re witnessing in real time his fascinating transformation from a comedian politician to Ukraine’s Winston Churchill)

Major General Mick Ryan is a former officer in the Australian Army, and has had excellent perspective on all things Russian, particularly the possible use of nuclear arms by Russia.

Tweets by WarintheFuture

Bookmark or subscribe to these resources and you’ll get a better sense of the full scope of this conflict.

Invest Wisely!


Filed Under: IronBridge Insights Tagged With: information, russia, Ukraine, war

Value Your Business like it’s Your Retirement Plan, Because it is.

February 18, 2022

Building a successful business can take decades. While working to grow, it’s common to use all available assets above the salary you pay yourself to fund future expansion. Where does that leave you on the retirement side of things? For most business owners, the retirement plan is some form of exit and monetization of your investment.

As you get close to a transition, valuing the business is paramount. The value comes first, and then the sale, and only then do many business owners think about how the sale proceeds will fund retirement. 

There’s a better way. Start with the amount of money you need to live the retired life you want. That’s your benchmark of the value you want to get for your business. Then work from there to create the value you need.

A Different Valuation Metric: What Do You Need to Retire?

Creating a retirement lifestyle should be about your goals, dreams, and plans for what you want to accomplish in the last several decades of your life. It shouldn’t be about plugging a number into a glorified spreadsheet and then eking a life out of whatever income pops out.

Think of it in three stages:

  1. What’s most important to you in the early stages of retirement? Travel? Family? Starting another business? How much will that cost?
  2. As you age, what do you want your life to look like? Where will you live? How will you spend your time? Do you want to be able to help children and grandchildren? Do you want to devote time to philanthropy? What level of income do you need in these years?
  3. What will your legacy be? How will you fund it?

Once you’ve thought through what your retirement looks like, you can begin to think about the amount of money you’ll need to make that happen.

As you begin transitioning your business to an exit, you’ll want to get a comprehensive, accurate valuation. Bridging gaps between what your business is worth and what you need should be your focus. It should guide your timeline and business investment decisions for several years before getting to a liquidation event.

Increasing Your Value

You’ve likely been focused on the long-term growth of your business and are used to planning and taking steps to keep a consistent upward trajectory in place, even if it’s not profitable right away. Value is a different mindset. You want to position your business to be the most attractive to a buyer, which means focusing on profits and getting everything else in place and ship-shape.

Increasing value breaks down to making improvements across several essential functions:

  1. Improve cash flow – lease instead of buy, reduce expenditures
  2. Increase profitability – improve margins from both cost and revenue
  3. Lower your risk – diversify revenue streams and create recurring revenue streams
  4. Streamline operations – inventory management, payroll control, etc.
  5. Attract and retain high-quality talent – qualified retirement plans, cash balance plans, stock plans
  6. Build or refresh your sales/marketing process
  7. Get your books in perfect shape

If you’re wondering how you’re supposed to do all that while running the business, that’s where it gets interesting. You’re not. The sales process has a very truncated timeline. The value of bringing in outside expertise is correspondingly greater. Even if you could do all those things yourself, you can’t do them all at the same time.

Creating the Team You Need

The best approach to getting ready for a sale is to create a team that can work with you to determine what needs to be done systematically, build a schedule to do it, and identify the right sources. Whether outsourcing or hiring in-house, you’ll need to create a working group of consultants – business, marketing, pension, etc. – along with investment bankers, CPAs for the company and those focused on tax structures, and a legal team that can handle the transaction.

Because your business, both now and in the future, is your source of wealth, it makes sense to work with a financial advisor that specializes in transitioning business owners to liquidity. Decisions should be made with your long-term wealth in mind, whether it is valuation, taxes, sales structure, monetizing assets, or your compensation for ongoing involvement. A fee-only financial advisor doesn’t have a conflict of interest, so they can develop the needed expertise to look across the entire transaction, quarterback your team, and then structure your resulting liquidity to create the retirement you want.

The Bottom Line

Selling a business to fund a retirement should start with the retirement part – that’s the goal. Everything else should be in service to that, and good planning can ensure that takes place. Working with a financial advisor to get your ducks in order can help you navigate the transition.


This work is powered by Seven Group under the Terms of Service and may be a derivative of the original. More information can be found here.

The information contained herein is intended to be used for educational purposes only and is not exhaustive. Diversification and/or any strategy that may be discussed does not guarantee against investment losses but are intended to help manage risk and return. If applicable, historical discussions and/or opinions are not predictive of future events. The content is presented in good faith and has been drawn from sources believed to be reliable. The content is not intended to be legal, tax or financial advice. Please consult a legal, tax or financial professional for information specific to your individual situation.

Filed Under: Strategic Wealth Blog Tagged With: considerations for selling a business, retirement planning, selling a business, value your business, wealth management

Ares: Forever Quarrelling

February 8, 2022

Ares, the god of war, statue representing both the valor and brutality of war. Ares was one of 12 original Olympians and a son of Zeus.

In Greek mythology, Ares was the God of War.

He was one of the 12 original Olympians, and a son of Zeus. He symbolized both the valor and brutality of war.

Much of Greek mythology comes from ancient writings, such as Homer’s Iliad.

In the Iliad, Zeus tells his son, Ares:

To me you are the most hateful of all gods who hold Olympus. Forever quarreling is dear to your heart, wars and battle.

zeus to his son ares, in Homer’s iliad

It is telling that the Greeks chose to have War represented in their 12 primary deities. But it is most telling that they portrayed the God of War as the worst one of the bunch.

28 centuries later, humanity still faces those who feel the pull of Ares. Specifically, Vladimir Putin. And his drumbeats of war are growing louder by the day.

The possibility of a Russian invasion into the Ukraine has been increasing for at least two months now. It now appears almost inevitable that Russia will invade.

(Unless, of course, this was a pre-planned show of force with a pre-negotiated peaceful resolution that helps both Putin and Biden with their constituents.)

But we digress.

We will not discuss the human impact of a potential invasion or war. We only hope that if an invasion occurs, death and destruction are minimized as much as possible. And we hope it does not escalate into a more broad conflict that includes China, European nations or the United States.

What we will do is focus on the potential impact on the markets. Specifically, we discuss:

  • Timing of a Potential Invasion
  • Are Markets Pricing in the Risk of War?
  • What happened after Previous Geopolitical Events?
  • What is the risk of Russian Attacks on our Infrastructure?

Let’s get to it.

Timing of a Potential Invasion

First of all, Russia has a history of invading countries when the US is preoccupied with other things.

  • They invaded Afghanistan on Christmas Eve in 1979.
  • They invaded Hungary two days before the Presidential election in 1956.

Russia’s two biggest adversaries, the US and China, are both pre-occupied right now.

  • China is hosting the winter Olympics, and are trying to look good on the world stage (although nobody seems to be watching).
  • The Super Bowl is this weekend in the US. It is annually one of the most-watched television events of the year.

So it appears that this weekend may make sense if they are going to invade.

However, people said that in December as well, projecting that Russia might again invade around Christmas and that didn’t happen.

We are no geopolitical experts, but we would not be surprised if an invasion happened this weekend.

Are Financial Markets Pricing in an Invasion?

Bottom line, no, they are not. And if they are, they simply don’t care.

Typically when financial markets are concerned about a negative potential event, money flows into US Treasuries, causing yields to go down. However, yields have risen recently, and there has been no flight into the safety of US Treasuries.

In fact, US Treasury yields have continued moving HIGHER, and are now back to pre-COVID levels, as shown in the chart below.

10-year us treasury yields have been moving higher, despite tensions between russia and ukraine

The spike higher on the far right side of the chart shows a bond market that is decidedly NOT pricing in any global instability.

If the global financial markets were concerned about this invasion, we would first see it expressed in lower yields, not higher ones.

In fact, since late November and early December (when rumors about a Russian invasion began), yields have only risen. They are up over 65 basis points in that time, which is a very large move in yields for the Treasury market.

Simply put, this is not a bond market that is concerned about an invasion.

The stock market isn’t much different.

Yes, we have seen volatility this year. But it appears for now that the choppiness this year is simply a market working off the froth after large gains over the past two years. Not an anticipation of further escalation in the conflict.

As invasion rumors have continued to gain momentum over the past couple of weeks, US markets have rallied.

What about in Europe?

Germany appears to be the biggest loser (besides Ukraine) in all of this. They get energy from Ukranian pipelines, and their economy appears to have the most to lose.

Well, European markets are basically telling the same story…that there isn’t much to worry about.

The next chart shows the Euro STOXX 50, an index of the 50 of the largest companies in 8 European countries, and the German DAX, which is Germany’s equivalent of the Dow Jones Index.

euro stoxx 50 index and the german dax leading up to a potential russian invastion of ukraine.

This chart shows European markets that have been choppy since last summer. You’d never know by this chart that there was about to be a war any day.

In fact, European stocks have fared much better than US stocks over the past month, despite having much more to lose if Russia invades Ukraine.

Bottom line, financial markets across the globe simply aren’t predicting any lasting impact of the potential conflict.

What Happened in Previous Geopolitical Events?

This isn’t the first time we’ve had geopolitical scares.

In fact, we wrote about this exact thing in 2017 when there was sabre rattling as tensions with North Korea began to flare. Read it HERE.

Somewhat to our surprise, we found that geopolitics simply don’t have the negative effect that many people think.

The next table shows the performance of the S&P 500 Index following major geopolitical shocks, courtesy of S&P Capital and the Wall Street Journal.

stock market reaction following major geopolitical events since pearl harbor

Essentially there were 3 events in the past 100 years that caused markets to fall more than 12%:

  • Lehman Bankruptcy (that started the global financial crisis)
  • The minor bear market in 1997 during the tech bubble
  • Nixon Resignation during the sideways bear market of the 1970’s.

In fact, EVERY war in the past century was a non-event to markets.

Surprising, huh?

Pearl Harbor, the Cuban Missile Crisis, JFK assasination, the first Iraq war, 9/11…all resulted in only moderate declines the day it was announced, and all resulted in completely normal pullbacks.

In January, we saw the S&P 500 fall 12%. It has recovered about half of that move so far.

So maybe the market ALREADY priced in Russia invading Ukraine, based on how stocks have responded to the start of previous wars.

What if Russia Attacks Infrastructure in the U.S.?

This is the biggest wildcard.

One of the concerns by some is if the United States put punitive sanctions on Russia, they would retaliate with an attack on our infrastructure.

An attack on our digital infrastructure would be a problem, but it appears that would be a temporary one. There is not just one internet or communication provider. There are many. So while a localized attack may cause localized disruption, it would be very difficult to stop the “web” of communication that exists across this country. Landlines, cell towers, satellites, all provide data to people. It is a very decentralized system that would be hard to attack.

Water and electricity resources is another potential target. But as we’ve witnessed in Texas over the past year, the power grid going down or water supply being compromised does indeed cause inconveniences. But it would not necessarily cause permanent or irreparable damage to the country.

So what would Russia have to gain? They cause major inconveniences to us? Just keep robo-calling us about our expired car warranties and call it a day.

Is the inconvenience worth starting World War III? It doesn’t seem like it.

Conclusion

Bottom line, financial markets aren’t concerned. There isn’t enough tension, risks and potential benefits to Russia to warrant expanded conflict. And expanded conflict is the real risk.

Ukraine is a strategic benefit for Russia, but is not crucial to the global economic or market infrastructure.

Financial markets are taking the approach that there will always be conflict. Humans will be forever quarreling. And they are taking the view that minor conflicts are not important enough to change the overall market and economic cycle.

We’re not saying that it for sure WON’T turn into something bigger. If it does, we will adjust portfolios accordingly. After all, the market can change its mind anytime.

But for now, it appears that if Russia does in fact invade Ukraine, there is not much to worry about when it comes to your portfolio.

Invest wisely!


Filed Under: IronBridge Insights Tagged With: ares, geopolitics, god of war, greek mythology, markets, risk, risk management, russia, treasury yields, Ukraine, war

Thinking Through “Life-Changing” Wealth

February 1, 2022

my new life chapter one. planning considerations when selling a business, receiving an inheritance or a successful investment.

Incorporating a large lump sum of money into a financial plan requires thinking through a series of impacts that happen over time.

There are financial, emotional, tax, legacy, employment and a host of other issues to be addressed.

Whether the influx is due to an inheritance, an asset sale, or an IPO, taking some time to adjust before making any decisions is a good idea.

We get into some immediate implications, and then some further down the road.

Take Time to Breathe

Before you address the changes a large sum of money will bring, you may want to process the events that led to the inflow.

The loss of someone you care about, the sale of a business you’ve built, the monetization of the work you’ve put into a career are all emotional events.

The cardinal rule of investing is to remove as much emotion as possible. So taking time to work through the underlying feelings before you think about the ongoing changes to your life is a healthy approach.

Prioritize

By far the most important part of this process is to prioritize your actions.

There are some issues that require your immediate attention:

Following the death of a loved one, for example, there is the ugly “business” of processing and settling the estate. Good planning can help make this transition a smooth one, but there are still steps you must take those first few weeks and months.

Selling a business or having a large inflow of stock options require careful tax analysis, which we discuss below.

With any inflow of wealth, you’ll need to address these immediate deadlines.

However, you shouldn’t feel that you need to develop an investing plan right away. Yes, there may be opportunity costs of not immediately getting funds invested, but it is far more prudent to develop a disciplined investment plan to avoid making costly investment mistakes with large sums of money. And the volatility you may be used to with your portfolio takes on a different meaning when you add a zero or two to the end of the values.

Also, if possible, you should avoid any large amounts of spending right away. Your needs, wants, goals, etc. may change as you get used to your new reality, and you don’t want to do anything that can’t be undone.

By prioritizing what decisions you need to make first, you can more easily process the inflow of wealth to help you avoid costly mistakes.

Understand the Cost of Taxes

The money may be yours – but the government most likely has a claim on some of it.

Having a very clear accounting of how much tax is due and when, and how you are going to pay it, is the first step. The taxes due may come out of the lump sum, or it may be more advantageous to pay the taxes from other sources of funds. You’ll need a plan to understand the right choice for you.

For example:

  • An inheritance may include very low-basis stocks that you do not want to sell. But it could have a step-up in cost basis that may warrant selling them first. Tax laws change over time, and understanding what you need to do to is critical.
  • You may choose to structure the sale of a business in a deferred sales trust, so that you can minimize taxes. You’ll need to set up and implement that structure, and plan for gaining access to the funds over time.
  • Post-IPO, you’ll be subject to taxes on your shares, and you’ll have some timelines you need to be aware of and taxes you’ll need to pay, whether you hold on to the stock or not.

Be sure to identify all tax strategies with a tax professional, because there may be ways to reduce your overall tax bill in the year that the event happens.

For example, if you have charitable inclinations, you might want to consider a gift in the year you received the lump sum. One example is via a Donor Advised Fund. Learn more HERE.

The ideal situation is to discuss potential tax implications prior to a large liquidity event when possible.

Rethink Your Approach to Risk Management – Both Investment Risk and Asset Risk

Adding a large sum to your overall financial picture will change how you think about risk.

You’ll need to assess your liability and protect your overall assets. This may mean an umbrella policy, structuring or titling assets differently, or in the case of an inheritance, it may mean a different insurance strategy.

Your investment goals may also change with time.

If you’ve sold a business and this is your retirement fund, your risk profile will look different than it did when you had a business creating income.

With an inheritance, an IPO, or other lump sum, you may decide to change, cut down, or stop work. This will create different time horizons for investing and different risk tolerances.

It may take time to understand what you want to do and put a plan in place.

Keeping assets as flexible as possible is the key to giving yourself choices as you move forward. You’ll want to minimize risk and avoid locking up funds until you have a clear understanding of your new goals.

Create a New Path Forward

Once you get used to your new situation, many people decide to make big changes.

These could include creating a legacy, actively gifting to help others, or using your funds to provide income for yourself so that you can devote your most valuable resource – your time – to causes you care about.

Or it may mean making a big purchase you’ve always wanted, travel, or just taking time to spend with family.

Most likely it is a combination of these dreams.

In the case of a business owner, you worked hard to get to where you are. You most likely made sacrifices that no one sees or knows about.

It is okay to enjoy your new wealth while still using it to positively impact others in whatever way you choose.

The Bottom Line

Thinking through your options means working carefully to create a financial plan that maximizes your assets, minimizes your taxes and provides for you and your loved ones.

The new plan may be bigger and more complicated, but the basic principles will still apply. You’ll still need to take the time to work with your team to set out what you want, and then put it into action.

We’re always here to talk it through with you.


Filed Under: Strategic Wealth Blog Tagged With: considerations for selling a business, inheritance, investing, ipo, portfolio management, selling a business, tax planning, wealth management

Fed Meeting: Popping the Bubble or Normal Volatility?

January 26, 2022

So much for the New Year’s wish of putting 2020 and 2021 behind us and getting back to normal.

Or are we?

The markets had one of the calmest years in history last year, mainly on the back of the mega-cap tech firms.

But that calm was shattered as the market fell over 12% in a few short weeks.

Which begs the question…”Is this normal, or is this a sign that the biggest bubble in the history of the world is popping?”

Before we dig in, we’ll mention that the Fed met today and not much came of it. Yes, markets reversed lower after the announcement, but there were no surprises today.

They reiterated that they plan to raise rates by 0.25% in March. And reiterated that the balance sheet is way too big for the current economic environment. Both of these are accurate and prudent.

The markets were hoping he would say that all potential rate hikes are off the table, but that was an unrealistic expectation. And one mostly fabricated by the financial media.

So the reality of the Fed this evening is exactly the same as the reality of the Fed at noon today.

Let’s move on to the markets.

The S&P 500

Markets have had a terrible start to the year. In fact, we’re off to the worst January in history.

From peak-to-trough, the S&P fell 12% (so far at least).

Let’s look at the chart.

December was actually a fairly choppy month, but as soon as the clock struck midnight on New Year’s Eve, markets began to drop without much relief.

The last time the market had any sort of mild correction was last September. It chopped around for a few weeks and moved higher into year end.

Now, the market is testing those levels, as shown in the blue shaded rectangle in the chart above.

The other thing the market is trying to do is to rebound during the day from a very weak start.

The market has had two consecutive reversal days. The bulls are trying to show that they aren’t ready to give up just yet.

On Monday, Jan 24th, the S&P was down as much as 3.99%. However, by the end of the day it was actually positive. That’s a HUGE reversal day that only has a few precedents.

Since 1950, there have been 88 times the S&P fell by this much in a single day.

Only 3 times (including Monday) it finished positive on the day.

The other two times? October 2008.

Yikes.

On the surface, this doesn’t appear to be very good.

October 2008 was the thick of the financial crisis. Banks were failing, the housing market was tumbling, and there was economic and market chaos.

We aren’t seeing anything close to that right now.

Outside of the supply chain bottlenecks, the overall economy is doing fine.

The bond market isn’t showing any signs of stress either.

In fact, the bond market is typically the better market to watch if you’re concerned with the potential for a large drop in equities.

Yield Curve and Yield Spreads

The yield curve and yield spreads are the two major bond market data points that have been the best indicator of economic and widespread financial market stress over decades.

The yield curve measures the difference between longer-term bonds and shorter-term bonds. Specifically, the difference between the 10-year Treasury yield and the 2-year Treasury yield.

When the 10-year yield is LOWER than the 2-year yield, the curve gets “inverted”. An inverted yield curve has preceded EVERY recession over the past 50 years, as shown in the next chart.

The yield curve isn’t showing ANY concern.

What about the other major data point…yield spreads?

Yield spreads measure the difference between yields on the safe bonds (US Treasuries) versus the yields on unsafe bonds (junk bonds).

Specifically, we look at the Baa Corporate Bond Yield and the 10-Year Treasury yield.

This spread is shown on the next chart, which goes back to the late 1990’s.

Every time the market fell 20%, yield spreads widened well before that happened. There has been NO widening of yield spreads this year.

Bottom line, the bond market isn’t worried.

So why all the volatility recently?

The answer is pretty easy. They even met this afternoon…the Fed.

The Fed

The Fed met today, and despite a late day market selloff, no real news came from the meeting.

They reiterated that they anticipate a 0.25% rate hike in March.

This was expected.

They said they would remain aware of economic and financial conditions, and would adjust their approach if the situation warrants.

This was also expected.

So there was actually very little “news” that came of the meeting today.

The real news happened a few weeks ago, when they released their minutes from their last Fed meeting of 2021.

In these minutes, they discussed a faster tightening that what the official messaging has been to the market.

The chart below shows when the minutes were released.

Oops. Since the release of the meeting notes, the market has gone pretty much straight down.

There were a couple of nice reversal days this week, but after the Fed meeting this afternoon, markets again fell.

So we’re getting mixed signals.

On one hand, the very speculative areas of the market are essentially collapsing:

  • Bitcoin is down almost 50%
  • Speculative tech stocks are down 70-80%
  • A whopping 42% of the stocks in the Nasdaq Composite Index are down over 50%

We’re seeing risk at the edges of the market.

Major stock indexes are also showing weakness. The S&P as we mentioned above fell 12%. The Nasdaq has been worse, falling 19% from peak-to-trough.

We’re NOT seeing risk at the core of the global markets…bonds.

Which side should we choose?

For now, we must assume that the volatility we have seen this year is normal.

10% corrections happen on average every 12-18 months. It’s been almost 2 years since we’ve seen one. So this type of volatility isn’t all that unusual.

It FEELS a little worse, because we had such low volatility last year.

And it may continue for a while longer.

But until we start to see risk show up in the more important areas of the market, we should expect an ultimate resolution higher.

That said, we have been taking steps to modify client portfolios. After all, we never know when a small correction will turn into the big one.

We increased cash two weeks ago. We have been rotating out of the more aggressive areas of the market into the traditionally more conservative areas.

International stocks have shown a tremendous amount of strength relative to their US counterparts. We have increased exposure there as well.

If the markets continue to show volatility, we will more aggressively raise cash. And we’re not far from those levels.

But the weight of the evidence, at least for now, suggests this pullback is normal. And frankly we should expect more of this type of volatility going forward.

It does not look like the start of the bursting of the bubble. At least not yet.

Invest wisely!

Filed Under: IronBridge Insights Tagged With: fed, federal reserve, inflation, interest rates, markets

5 Themes for 2022 and Why We Hate Year-End Predictions

January 14, 2022

Fortune teller reading future with crystal ball. Seance concept.

We hate year-end predictions.

Maybe “hate” is the wrong word…it is far to kind.

We absolutely despise the cringeworthy year-end predictions that accompany this time of year. (Feel free to imagine other colorful adjectives we may use to describe them.)

Why?

  1. Because they are worthless.
  2. There is no accountability whatsoever for those who make them.
  3. There is no way to accurately predict such a complex system as the global financial markets with any consistency, other than using the most commonly occurring outcome of an historical return bell-curve.
  4. Did we mention they were worthless?

Case in point…the six largest investment firms in the world missed last year’s performance by nearly 20 percentage points on the S&P 500. Oof.

Our apologies in advance if you’re looking for our wild-ass guess expertly modeled estimate of what the S&P 500 will be on December 31, 2022.

As our clients hopefully know, we don’t try to predict what will happen. Instead, we try to listen intently to the markets and let our rules drive the investment decisions.

So instead of sharing our predictions, let’s instead share the five themes we’re tracking for the upcoming year.

Theme 1: The Fed

For those who regularly read our reports, there’s no surprise here that the Fed holds the top spot in themes we’re watching this year.

The Fed is the Alabama Crimson Tide of the financial world. They are always among the top few drivers of what will happen during the season. And unless you’re on the team or an alumni, most people are pretty tired of you by now.

More accurately, the Fed IS the driver of the market. It has been since 2009. So we MUST pay attention to what they are doing.

Right now, despite the talk from Chairman Powell about tightening and raising rates, they are still expanding their balance sheet.

Federal Reserve Balance Sheet has been increasing despite Powell saying they are tapering.

The increase in the Fed’s balance sheet is the single biggest contributor to both the increase in the stock market, as well as the re-emergence of inflation across the globe.

It is also a reason why we’ve only seen minor pullbacks since COVID began.

The eventual reduction by the Fed is very likely to lead to a much choppier environment for stocks, and at some point an outright bear market.

Whether that happens in 2022 or not is anyone’s guess.

But as of right now they are scheduled to begin reducing their balance sheet this year, not just slowing down the increase of it.

Paying attention to global markets when the Fed ACTS, instead of when they SPEAK, will be key for risk assets this year.

Theme 2: Inflation

The second theme to watch this year, and the natural follow up to the Fed, is inflation.

We’ve all seen it recently. From cars to steaks to milk to $10 packets of bacon. Everything costs more.

In fact, inflation just recorded the largest year-over-year increase in 40 years. It rose 7% in the past 12 months, as shown in the chart below.

On the surface, this looks ominous. We haven’t seen an inflationary environment since the 1970’s, and that decade was not a good time to passively invest in stocks.

However, our belief is that inflation will not increase and stay at elevated levels.

Instead, we think it will occur in waves.

We wrote about inflation numerous times last year (click to read):

  • The Coming Inflation Waves
  • Increased Gas Prices Signal both Post-COVID Norm and Inflation
  • The First Wave of Inflation is Receding

Lumber is a good example of our inflation-wave thesis.

After skyrocketing the first part of 2021, lumber prices subsequently collapsed. Now, they are skyrocketing again.

Take a look at the extreme moves in lumber recently.

This chart is pretty amazing. We’re talking about the price of LUMBER. Not some phantom crypto-coin being schlepped by a Kardashian.

Lumber is an excellent case study for this environment. There are demand influences, supply chain issues and quality differences in various types of lumber that contribute to this massive volatility. And for the most part, it does not have governmental influences on it like the cost of healthcare does.

Inflation has far-reaching ramifications. Not only for asset prices and the economy, but for society as a whole.

Higher prices hurt consumers. They hurt businesses without pricing power. They cause massive price adjustments in all sorts of areas. Inflation also has massive political implications as a disgruntled populace focuses its frustrations on political leaders.

This quote by John Maynard Keynes is fairly long, but worth the read:

By a continuing process of inflation, governments can confiscate, secretly and unobserved, an important part of the wealth of their citizens. By this method they not only confiscate, but they confiscate arbitrarily; and, while the process impoverishes many, it actually enriches some. The sight of this arbitrary rearrangement of riches strikes not only at security, but at confidence in the equity of the existing distribution the system brings windfalls, beyond their deserts and even beyond their expectations or desires, become ‘profiteers,’ who are the object of the hatred of the bourgeoisie, whom the inflationism has impoverished, not less than of the proletariat. As the inflation proceeds and the real value of the currency fluctuates wildly from month to month, all permanent relations between debtors and creditors, which form the ultimate foundation of capitalism, become so utterly disordered as to be almost meaningless; and the process of wealth-getting degenerates into a gamble and a lottery.

– John Maynar Keynes

Sounds pretty applicable to today. It was written in 1920.

We don’t expect inflation to cause massive societal disruptions this year, but we sure can see the foundation being laid for that to happen.

Inflation needs to be near the top of things to watch this year. And the coming decade for that matter.

Theme 3: Interest Rates

The third major driver of markets and the economy is the prevailing interest rate environment.

The COVID Crash in March 2020 pushed yields to their lowest levels in history. Not just recent history. All-time history. In the entire history of recorded financial records, dating back to ancient Egypt 4000 years before Christ, interest rates were never lower than they were two years ago.

Since then, they have marched higher. And they are currently trying to move beyond their highest levels since COVID began, as shown in the next chart.

Higher interest rates affect many areas. Real estate, fixed income markets and global currencies all have some sort of tie to interest rates. Not to mention more complicated instruments like derivatives and futures contracts.

Stocks are a bit different.

Higher interest rates aren’t necessarily bad for stocks all the time.

In fact, stocks tend to do just fine when rates rise.

The next chart, courtesy of LPL Financial’s Ryan Detrick, shows the performance of the S&P 500 each time the 10-year yield has risen by more than 1.00% (or 100 basis points).

Since 1962, there have been 14 times when the 10-year Treasury yields has risen by more than 100 basis points. Stocks were higher 11 of those times by an average of 17.3%.

Granted, most of these periods occurred during the massive bull market we’ve had over the past 40 years, but this is still an impressive statistic nonetheless.

While parts of the market are likely to suffer as interest rates rise, we shouldn’t assume that higher interest rates will automatically make stocks go down.

We are likely to find out if this holds true again this year.

Theme 4: Risk Makes a Comeback

The S&P 500 had an excellent year in 2021. CNBC and most financial news outlets primarily focus on the performance of this behemoth index.

But last year did have its share of risk if you looked outside of the large cap growth stocks.

The chart below shows the performance of various assets since last February.

The S&P is the leader by far. It was up almost 22% before the turn of the new year, since last February alone.

However, other assets didn’t perform so well during that same time:

  • International stocks were barely higher (Up 3%)
  • Small Caps lost value (Down 7%)
  • Emerging Markets down big (Down 13%)
  • China was substantially lower (Down almost 30%)
  • Even the high-flying ARKK investment ETF, run by Cathie Wood and epitomizing the speculative edges of the markets, fell by nearly 50% since last February.
  • Bitcoin is down nearly 40% in the past two months (not shown on the chart above). Not what we consider to be an effective a store of value, especially with inflation at 7%.

Why did the S&P returns exceed other areas of the market so much?

Simple…nearly 30% of the index is in the top 5 stocks. And those stocks did amazingly well last year.

The rest of the financial world experienced weakness or outright bear markets already.

The main question for this year is whether the rest of the world can do well if the top stocks in the S&P 500 do poorly.

If they can, which is an excellent possibility, then there will be more opportunity in owning things outside of the big tech companies. In our view, this is the likely path forward.

But if they can’t, and the rest of the world remains weak while the heavy lifters in the S&P 500 deteriorate, then it could be a difficult year across the board.

There are mixed messages here, and the answers are not clear. So you must adapt as the things develop, whether they become bullish or bearish.

Theme 5: Another Damn Election

It’s a mid-term year, and the fully saturated political environment is going to soak us once again.

In an ideal world, politics shouldn’t influence asset prices. But in our world they do.

Remember the performance of Chinese stocks from the chart above? A number of Chinese companies have excellent business models, fantastic customer bases and thriving businesses, but political influences caused massive declines in the performance of their stock last year, and it brought down the entire stock index in that country.

With this being an election year, there are some key areas of the market that could be made into whipping boys this year.

The two most likely targets? Big Tech and Big Oil.

We’re starting to hear rumblings from Washington about their intentions.

The big social media companies are scheduled to testify to Congress soon. And our beloved politicians won’t miss the opportunity to send an outlandish quote hurling through the echo chamber to get on the front page nationwide.

Same with big oil. We’re already hearing from President Biden that oil companies are gouging the American people. Maybe he’s right, maybe not. But we should expect them to be a target this year as well.

Despite of whether there is political influence or not, midterm election years tend to have increased volatility on average.

The next chart, again courtesy of LPL Financial, shows This chart shows the average return of each year of the 4-year Presidential Cycle since 1950.

Specifically, it shows that Midterm years have an average drawdown of 17% during the course of the year.

It also shows that on average, stocks are higher by 32% a year after the lows.

While each year has its own specific characteristics and abnormalities, the Presidential Cycle data suggests we should see some volatility this year, but should expect a nice recovery.

Bottom Line

Bottom line, the market is finishing up a strange year in 2021. The S&P 500 did great, but other areas didn’t do as well.

And markets are off to a fairly rocky start to the year so far. But the overall trend still remains higher, at least for now.

Where the market ends up at the end of the year is anyone’s guess. But we’ll keep adjusting portfolios as the data warrants, and will work hard to both protect and grow your hard-earned wealth.

Invest wisely!


Filed Under: IronBridge Insights Tagged With: 2022, federal reserve, inflation, interest rates, new year, predictions, stock market, trends, volatility

  • « Go to Previous Page
  • Go to page 1
  • Interim pages omitted …
  • Go to page 3
  • Go to page 4
  • Go to page 5
  • Go to page 6
  • Go to page 7
  • Interim pages omitted …
  • Go to page 19
  • Go to Next Page »

Footer

LET'S CONNECT

  • Email
  • Facebook
  • Instagram
  • LinkedIn
  • Twitter

AUSTIN LOCATION

6420 Bee Caves Rd, Suite 201

Austin, Texas 78746

DISCLOSURES

Form ADV  |  Privacy Policy  |  Website Disclosures

  • Home
  • Difference
  • Process
  • Services
  • Insights
  • Team
  • Clients
  • Form CRS
  • Contact Us

Copyright © 2017-Present by IronBridge Private Wealth, LLC. All rights reserved.